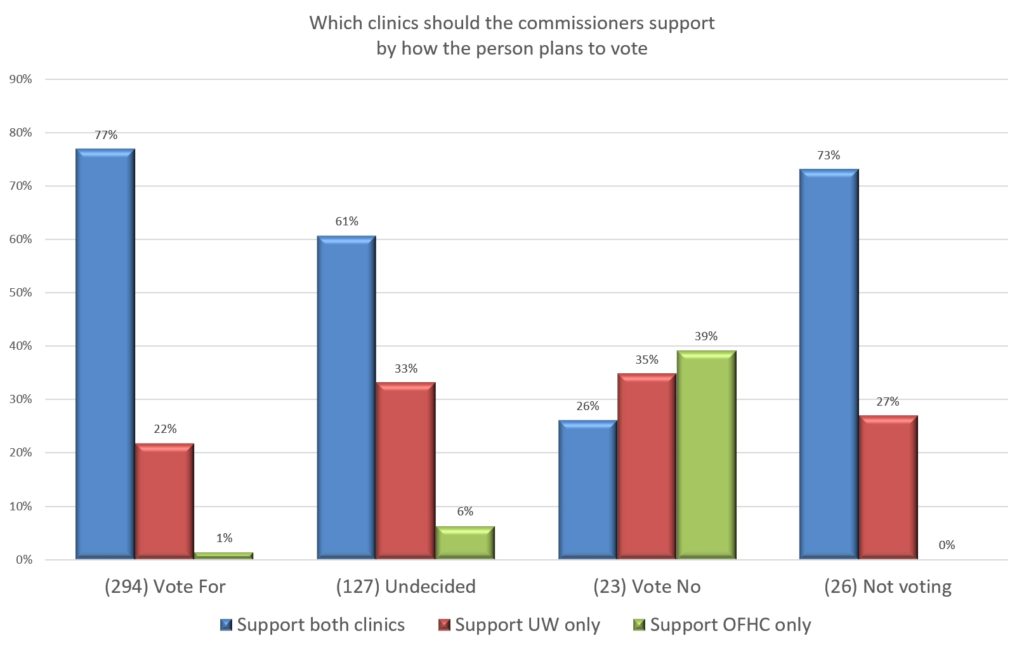
One of our questions asked if the commissioners should support:
There are 470 people who answered this and also indicated how they planned to vote. The numbers in parentheses are how many are in each vote category. The percentages on each bar are the percentage of people in that vote plan who support one idea or the other. Each group of bars should add up to 100%.
In each vote group, there is strong support for the idea of subsidizing both clinics, with the exception of those planning to vote “no.” The plurality of those planning to vote “no” want the commissioners to support only Orcas Family Health Center (Dr. Shinstrom). Our interpretation of this is that those who are currently using OFHC might be concerned the commissioners will support just one clinic, and they are afraid it will not be the clinic they prefer to use.
Click to enlarge; backspace to return here.
Keep in mind that the number of people planning to vote “no” (total of 23) is a very small sample. We can be 95% confident that, of those planning to vote “yes,” we are within 5.5% +/- of what the graph shows.
Next, we wanted to know how confident we should be of the percentages for those who plan to vote “no.” Our graph shows 30% of those voting “no” want the commissioners to support only OFHC. Because we have very few people in this “voting ‘no'” category, our confidence level drops considerably. Now, we are only 90% confident that the percentages for those voting “no” are +/- 22%. That is a very large range. In other words, when working with very small subsets of data, realize that our confidence in the numbers is much lower.

